GenomeProt: an integrated proteogenomics data analysis platform for long-read RNA-Seq datasets
Developed by Hitesh Kore, Ching Yin and Josie Gleeson at The University of Melbourne
Workflow steps:
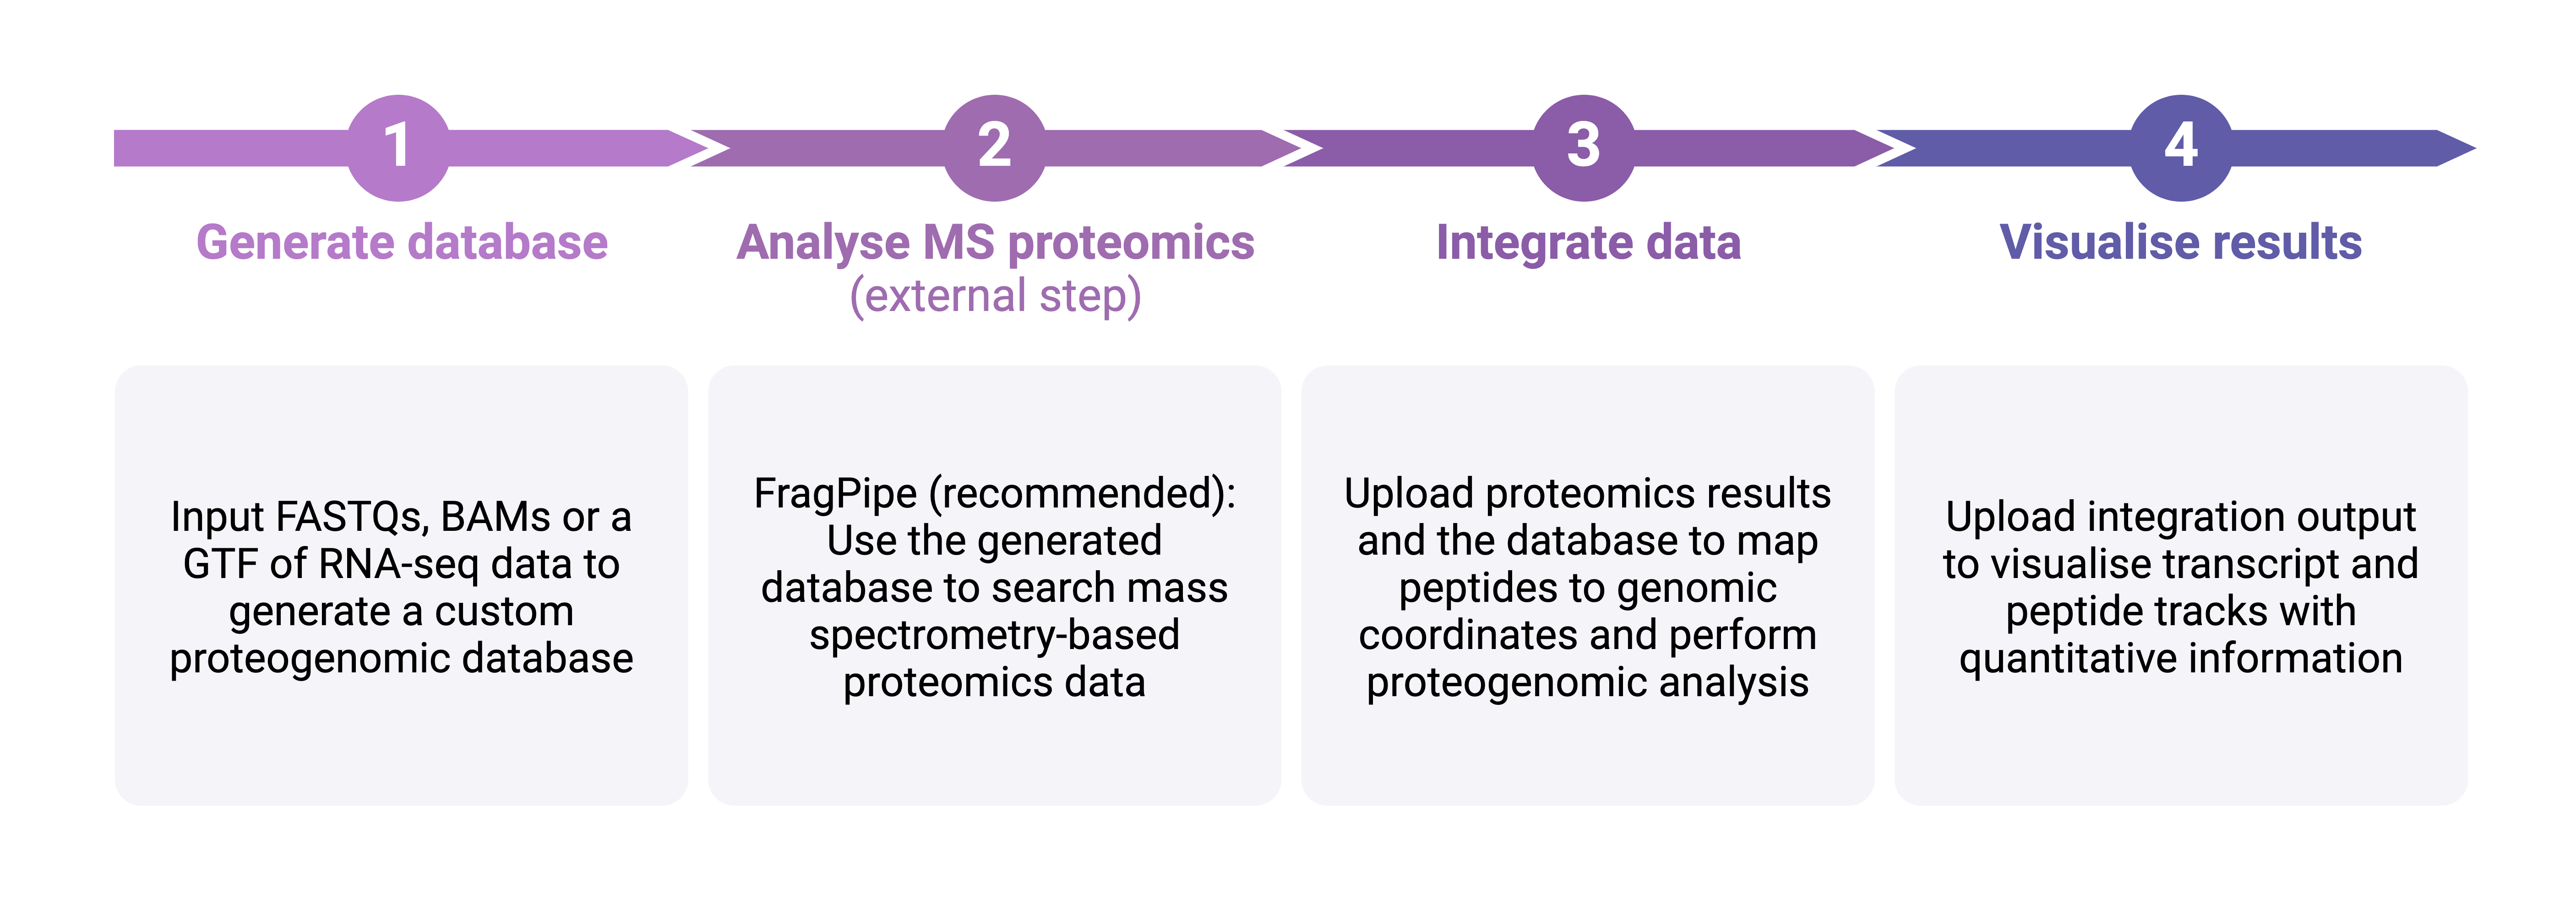
Generate a custom proteogenomics database
Creates an amino acid FASTA of all ORFs in your data to use as input for FragPipe/MaxQuant etc.
Find short (10 to 'ORF length' amino acids) ORFs in UTRs of reference transcripts:
Integrate proteomics results with transcriptomics
Creates BED12s and GTFs of peptides, ORFs and transcripts for visualisation and produces summary data
Visualise results
Plots your results using the GTFs created in the integration module.
Filter gene list for:
UMP = uniquely mapped peptide. Peptides that only mapped to a single protein entry in the protein database.
Visualise results with IsoVis
The IsoVis website is displayed below for convenience. It is also accessible directly at: https://isomix.org/isovis/
Instructions for using IsoVis
Step 1: Click 'Upload data'. For the 'Stack data' upload 'transcripts_and_ORFs_for_isovis.gtf'. For the 'Heatmap data' upload 'bambu_transcript_counts.txt'.
Step 2: Check the box 'Show peptide data upload options'.
Step 3: For the 'Peptide sites data' upload 'peptides.bed12'. For the 'Peptide intensities data' upload the intensities file. Then click 'Apply'.
Step 4: Type a gene to view and press enter.
Step 5: Click 'Stack options' and select 'Peptide sites' from the drop-down menu.